Research

The 14% Question: why PEO adoption stalls.

A look at what the industry's own research says, where it stops, and what we think is missing. PEOs serve about 14% of US businesses with 20 to 499 employees (NAPEO, PEO Industry Footprint 2026).

The question

If PEOs save money, why do so few businesses use one?

PEOs serve about 14% of US businesses with 20 to 499 employees, about 1 in 7 (NAPEO, PEO Industry Footprint 2026).

The savings case is on paper. NAPEO's ROI white paper puts the average client's savings at $1,775 per employee per year against a PEO cost of $1,395, a 27.2% annual return (NAPEO, The ROI of Using a PEO, 2019).

If the math works, why so few?
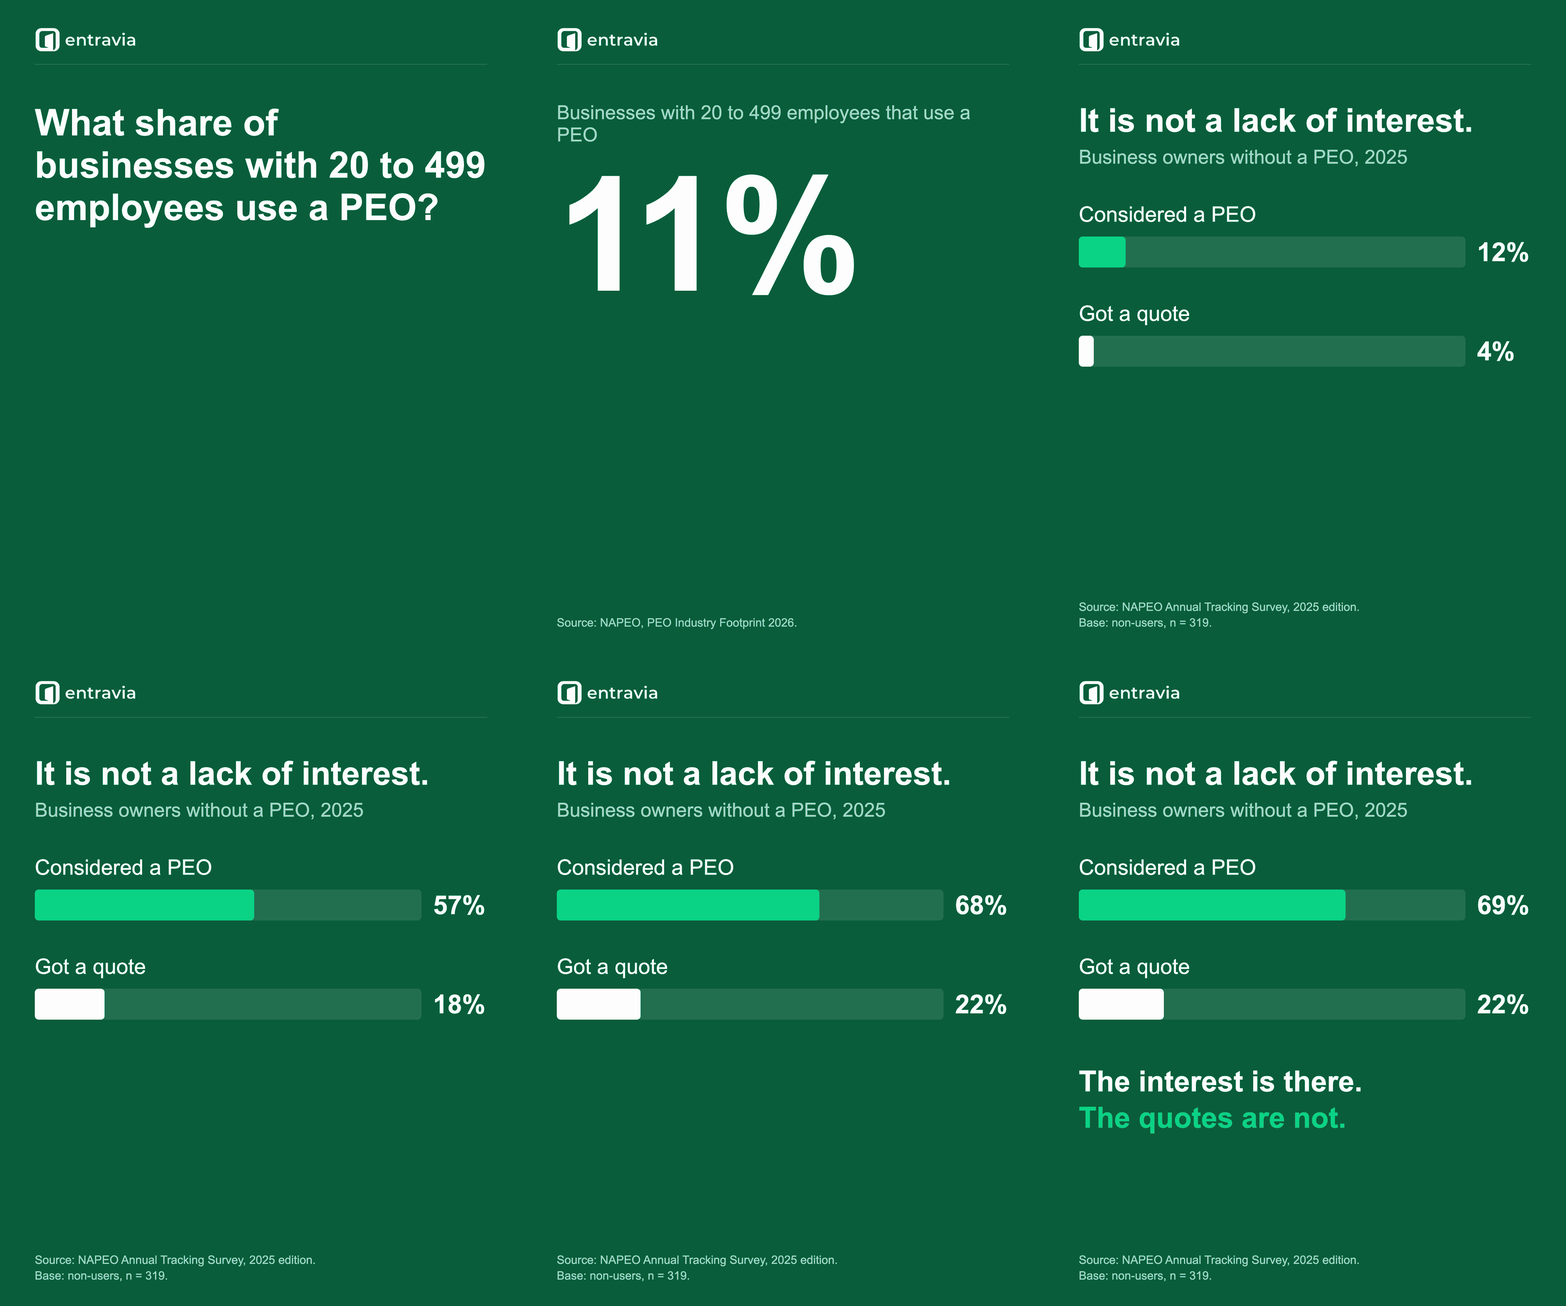
Animated graphic. It asks what share of US businesses with 20 to 499 employees use a PEO and gives you a moment to guess. Then it reveals 14%, about 1 in 7. A closing card shows that among business owners without a PEO in 2025, 69% considered one and 22% got a quote.
Source: NAPEO, PEO Industry Footprint 2026 (14%); NAPEO 2025 Annual Tracking Survey (69% and 22%, non-users). "Got a quote" is NAPEO's "received a formal proposal."
What the research says

Interest is high. Formal proposals are rare.

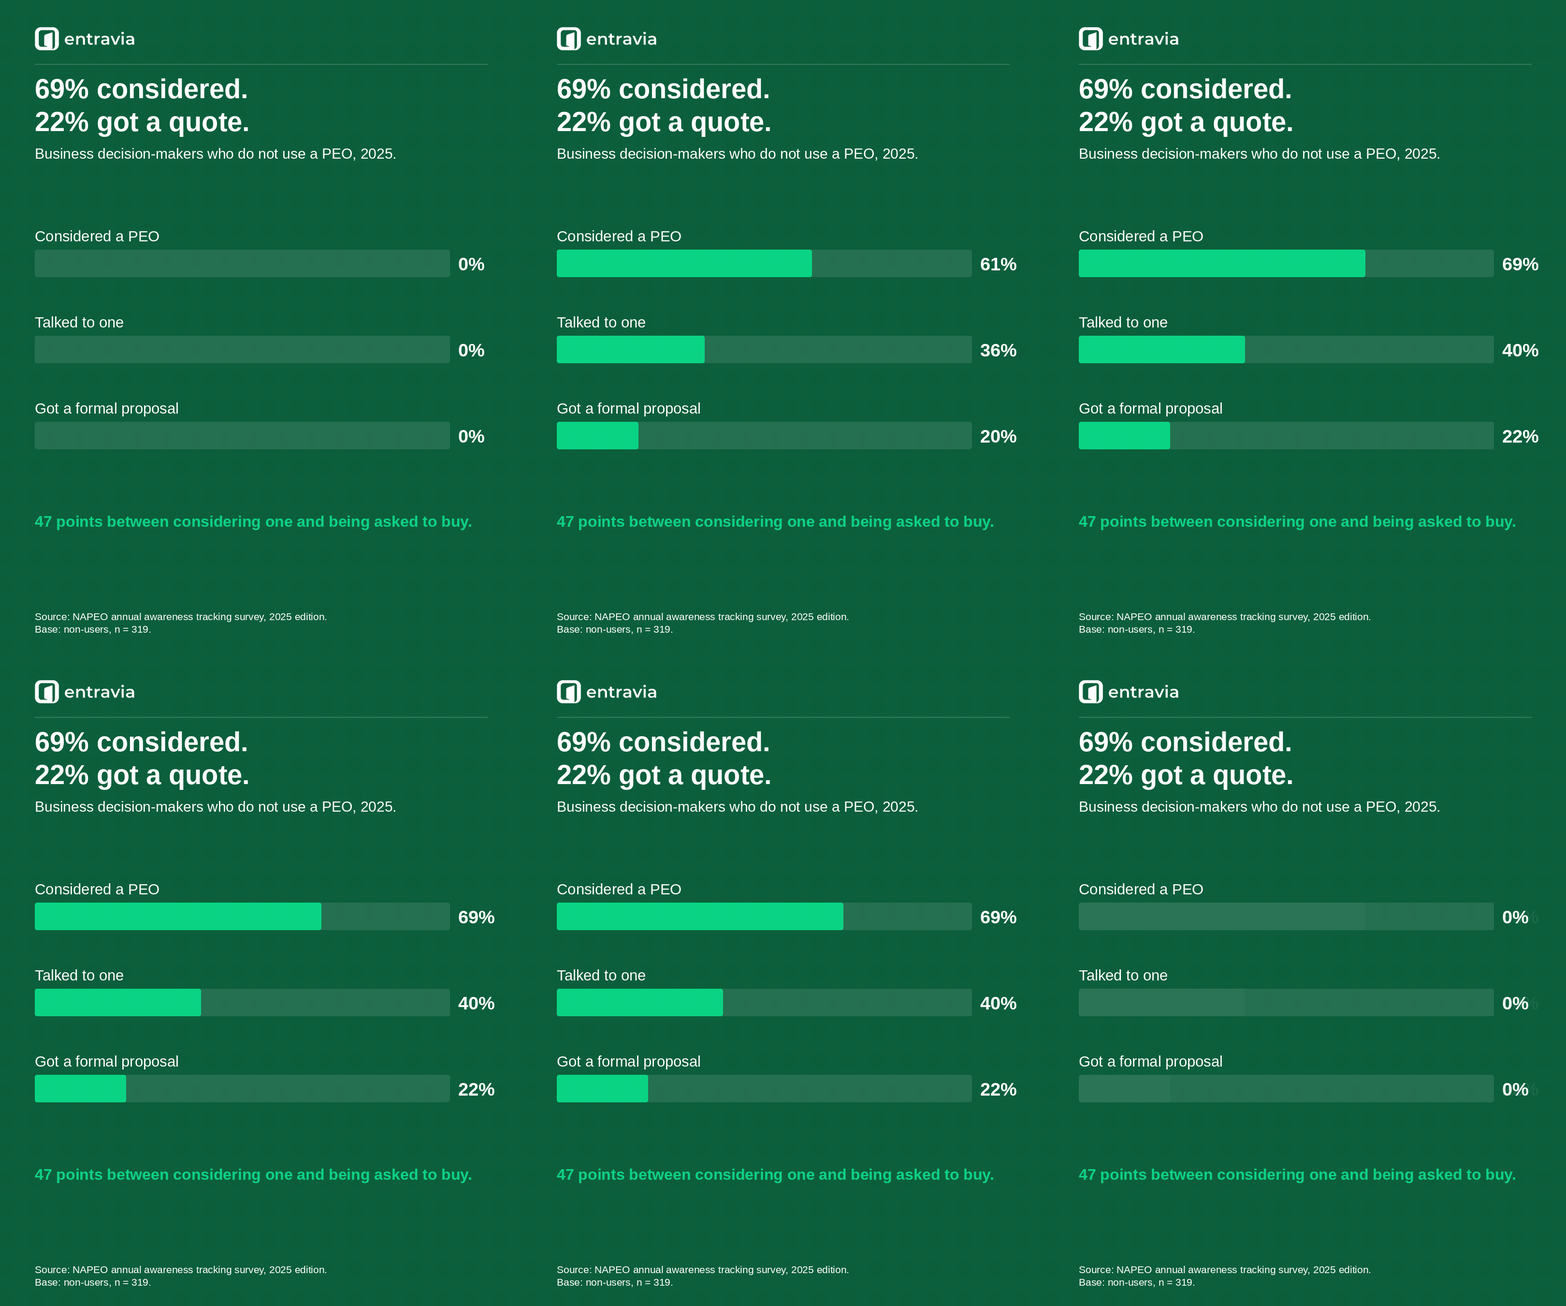
NAPEO's annual tracking surveys ask business decision makers who do not use a PEO how far they got. Two years in a row, the funnel looks the same.

Where the savings come from: of the $1,775 average annual savings per employee, 37% comes from health benefits and 59% from HR administration (54% internal HR staff, 5% other HR spending) (NAPEO, The ROI of Using a PEO, 2019).

Animated bar chart titled 69% considered, 22% got a quote, for business decision makers who do not use a PEO, 2025. The bars fill for considered a PEO, talked to one, and got a formal proposal, ending at 69% considered and 22% with a formal proposal.
Source: NAPEO 2025 Annual Tracking Survey, business decision makers who do not use a PEO. Full report is members-only.
Where it stops

Entravia's view: the gap is process, not appetite.

This section is our opinion, not a research finding.

The surveys measure interest and outcomes. They do not ask why a PEO that was considered never turned into a quote.

Our read is that much of the drop between considering a PEO and getting a formal proposal is process. Someone has to collect the census, plan documents and payroll reports, put them in the format each PEO asks for, chase what is missing, and then repeat it for the next PEO, one at a time. Every one of those steps is a place for a deal to sit until the moment passes.

We have not seen public research that tests this, so treat it as a view to argue with. It is the problem Entravia is built around.

What we are asking

Where do your PEO deals stall between "considering" and "quote"?

If you are a benefits broker or on a PEO sales team, you see this stage up close. Show us where it breaks on your deals, and we will show you how Entravia handles it.

Sources

Sources

  1. NAPEO, "PEO Industry Footprint 2026" white paper, 2026. https://napeo.org/wp-content/uploads/2026/10/PEOIndustryFootprint_WhitePaper2026.pdf
  2. NAPEO, "2024 Annual Tracking Survey: Key Findings Report." Business decision makers, n=502; non-users n=332. https://napeo.org/wp-content/uploads/2025/04/napeo-2024-annual-tracking-survey-key-findings-report.pdf
  3. NAPEO 2025 Annual Tracking Survey. n=500, fielded November 18 to December 9, 2025. The full report is for NAPEO members; public summary in NAPEO's press release, "New NAPEO Survey Shows Small and Mid-Sized Businesses Remain Optimistic but Increasingly Focused on Economic Uncertainty and Cost Pressures." https://napeo.org/press-releases/new-napeo-survey-shows-small-and-mid-sized-businesses-remain-optimistic-but-increasingly-focused-on-economic-uncertainty-and-cost-pressures/
  4. Laurie Bassi and Dan McMurrer, McBassi & Company, "The ROI of Using a PEO," NAPEO white paper, September 2019. https://napeo.org/wp-content/uploads/2025/03/white-paper-7-the-roi-of-using-a-peo.pdf

Last updated November 18, 2026. Opinion in "Where it stops" is Entravia's view and is labeled as such.